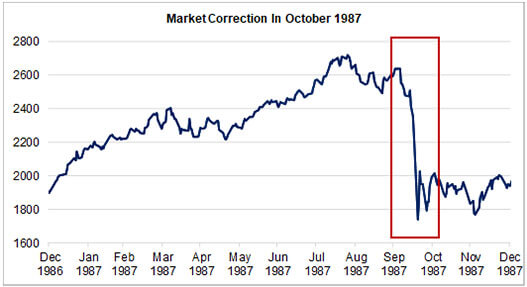
With the Dow at over a record 23,000, we just passed the 28th anniversary of the October 19, 1987 stock market crash, in which the Dow fell 508 points, or 22.6% in one day. That would be the equivalent of about a 5,000 point drop today! I was a Certified Financial Planner with six years of experience at that time. Those were scary times because the shock came from out of the blue. I can remember it like it was yesterday. Fear and panic were everywhere. We didn’t have a Quotron machine in our office and the Internet didn’t exist then, so one of the most difficult parts was getting timely and reliable information about what was happening. What I most remember was watching the Nightly Business Report and the McNeil-Lehrer News Hour that evening and for the next several evenings afterward. Back then, it was about the only way to get financial information before the next morning’sWall Street Journal.

Source: Dow Jones price data from Morningstar, graph from Focus Point Solutions.
The gurus who just a few weeks earlier where predicting an even higher stock market, were now saying that the stock market was no longer a good place to be. I remember an uneasy feeling as pundits predicted the start of the next Great Depression and the end of prosperity, as we knew it. As a financial advisor, I wondered what to tell my worried clients, but I decided to urge them to stay put. Fortunately, most of them followed my advice as they also did in 2008-09. The pundits were wrong, as they often are. Life went on, and with some major ups and downs along the way, we have enjoyed unprecedented market gains and prosperity. The Dow has risen 1200% since that day 30 years ago.
What is the difference between then and now?
Most experts agree that the crash was essentially an inter-market event driven by an imbalance between futures markets and the cash market for shares. Prior to Black Monday, interest rates had risen sharply to 10%. The Fed, under the direction of Chairman Paul Volker, made controlling inflation its top priority. This made stocks worth less, even though they were in a huge speculative rally, with the Dow up 43% for the year.
This year, we have a more tempered +15% stock return, much more globally-focused markets and economics. We have continued low interest rates with persistent low inflation acting as a downward-pulling anchor.
Some safeguards and so-called “circuit breakers” were put in place, which for the most part, have worked as intended. Today’s financial markets are much deeper and more liquid. The markets trade around the clock, around the globe with better built-in controls and more proactive central banks. This can cut both ways because global events can affect financial markets at home and abroad.

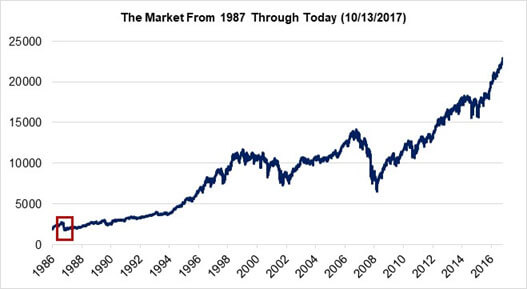
Source: Dow Jones price data from Morningstar, graph from Focus Point Solutions.
We have previously published charts of the 2008-2009 market meltdown through 2016. For another compelling set of charts, please see our March 10, 2016 post entitled, “Happy Birthday, Mr. Bull.” Although we don’t have a 30-year time frame yet, the stock market recovery has been even more dramatic than the 1987 recovery, as you can see in the chart above.
Conclusion? As you look at the red box in the two charts, we encourage you as your financial advisor to think outside of the short-term market box in which we sometimes find ourselves. Think long term.

